Task Planning
Task Planning
Planning in LibrePlan is a process that has been described throughout the user guide, with the chapters on projects and resource assignment being particularly important. This chapter describes the basic planning procedures after the project and Gantt charts have been properly configured.
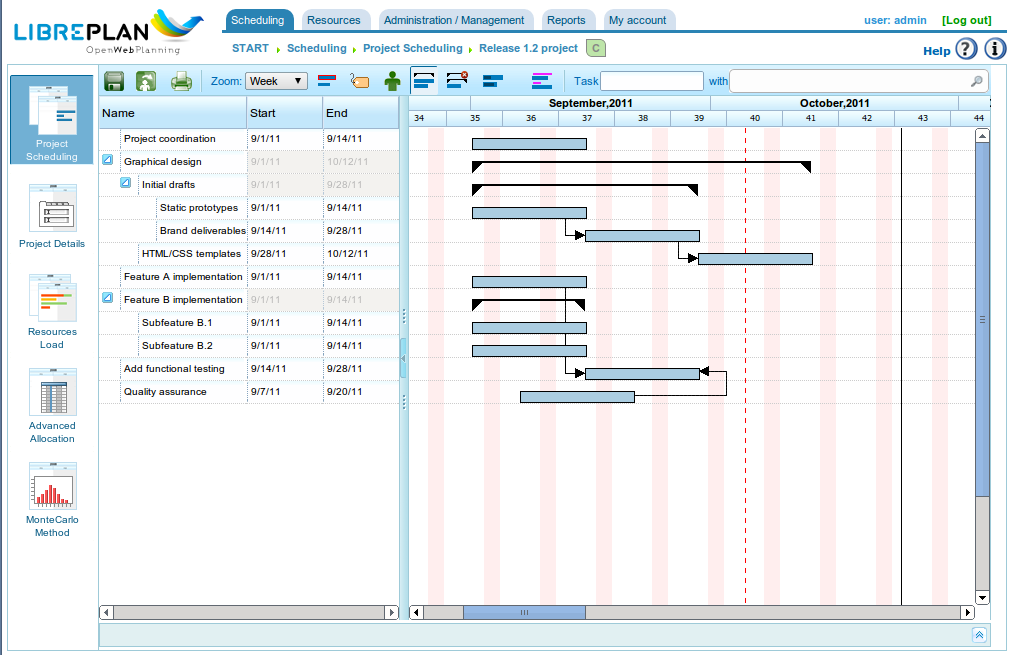
Work Planning View
As with the company overview, the project planning view is divided into several views based on the information being analyzed. The views available for a specific project are:
- Planning View
- Resource Load View
- Project List View
- Advanced Assignment View
Planning View
The Planning View combines three different perspectives:
- Project Planning: Project planning is displayed in the upper right-hand part of the program as a Gantt chart. This view allows users to temporarily move tasks, assign dependencies between them, define milestones, and establish restrictions.
- Resource Load: The Resource Load view, located in the lower right-hand part of the screen, shows resource availability based on assignments, as opposed to the assignments made to tasks. The information displayed in this view is as follows:
- Purple Area: Indicates a resource load below 100% of its capacity.
- Green Area: Indicates a resource load below 100%, resulting from the resource being planned for another project.
- Orange Area: Indicates a resource load over 100% as a result of the current project.
- Yellow Area: Indicates a resource load over 100% as a result of other projects.
- Graph View and Earned Value Indicators: These can be viewed from the "Earned Value" tab. The generated graph is based on the earned value technique, and the indicators are calculated for each workday of the project. The calculated indicators are:
- BCWS (Budgeted Cost of Work Scheduled): The cumulative time function for the number of hours planned up to a certain date. It will be 0 at the planned start of the task and equal to the total number of planned hours at the end. As with all cumulative graphs, it will always increase. The function for a task will be the sum of the daily assignments until the calculation date. This function has values for all times, provided that resources have been assigned.
- ACWP (Actual Cost of Work Performed): The cumulative time function for the hours reported in work reports up to a certain date. This function will only have a value of 0 before the date of the task's first work report, and its value will continue to increase as time passes and work report hours are added. It will have no value after the date of the last work report.
- BCWP (Budgeted Cost of Work Performed): The cumulative time function that includes the resultant value of multiplying task progress by the amount of work that the task was estimated to require for completion. This function's values increase as time passes, as do progress values. Progress is multiplied by the total number of estimated hours for all tasks. The BCWP value is the sum of the values for the tasks being calculated. Progress is totaled when it is configured.
- CV (Cost Variance): CV = BCWP - ACWP
- SV (Schedule Variance): SV = BCWP - BCWS
- BAC (Budget at Completion): BAC = max (BCWS)
- EAC (Estimate at Completion): EAC = (ACWP / BCWP) * BAC
- VAC (Variance at Completion): VAC = BAC - EAC
- ETC (Estimate to Complete): ETC = EAC - ACWP
- CPI (Cost Performance Index): CPI = BCWP / ACWP
- SPI (Schedule Performance Index): SPI = BCWP / BCWS
In the project planning view, users can perform the following actions:
- Assigning Dependencies: Right-click a task, choose "Add dependency," and drag the mouse pointer to the task to which the dependency should be assigned.
- To change the type of dependency, right-click the dependency and choose the desired type.
- Creating a New Milestone: Click the task before which the milestone is to be added and select the "Add milestone" option. Milestones can be moved by selecting the milestone with the mouse pointer and dragging it to the desired position.
- Moving Tasks without Disturbing Dependencies: Right-click the body of the task and drag it to the desired position. If no restrictions or dependencies are violated, the system will update the daily assignment of resources to the task and place the task on the selected date.
- Assigning Restrictions: Click the task in question and select the "Task properties" option. A pop-up window will appear with a "Restrictions" field that can be modified. Restrictions can conflict with dependencies, which is why each project specifies whether dependencies take priority over restrictions. The restrictions that can be established are:
- As Soon as Possible: Indicates that the task must start as soon as possible.
- Not Before: Indicates that the task must not start before a certain date.
- Start on a Specific Date: Indicates that the task must start on a specific date.
The planning view also offers several procedures that function as viewing options:
- Zoom Level: Users can choose the desired zoom level. There are several zoom levels: annual, four-monthly, monthly, weekly, and daily.
- Search Filters: Users can filter tasks based on labels or criteria.
- Critical Path: As a result of using the Dijkstra algorithm to calculate paths on graphs, the critical path was implemented. It can be viewed by clicking the "Critical path" button in the viewing options.
- Show Labels: Enables users to view the labels assigned to tasks in a project, which can be viewed on screen or printed.
- Show Resources: Enables users to view the resources assigned to tasks in a project, which can be viewed on screen or printed.
- Print: Enables users to print the Gantt chart being viewed.
Resource Load View
The Resource Load View provides a list of resources that contains a list of tasks or criteria that generate workloads. Each task or criterion is shown as a Gantt chart so that the start and end dates of the load can be seen. A different color is shown depending on whether the resource has a load that is higher or lower than 100%:
- Green: Load lower than 100%
- Orange: 100% load
- Red: Load over 100%
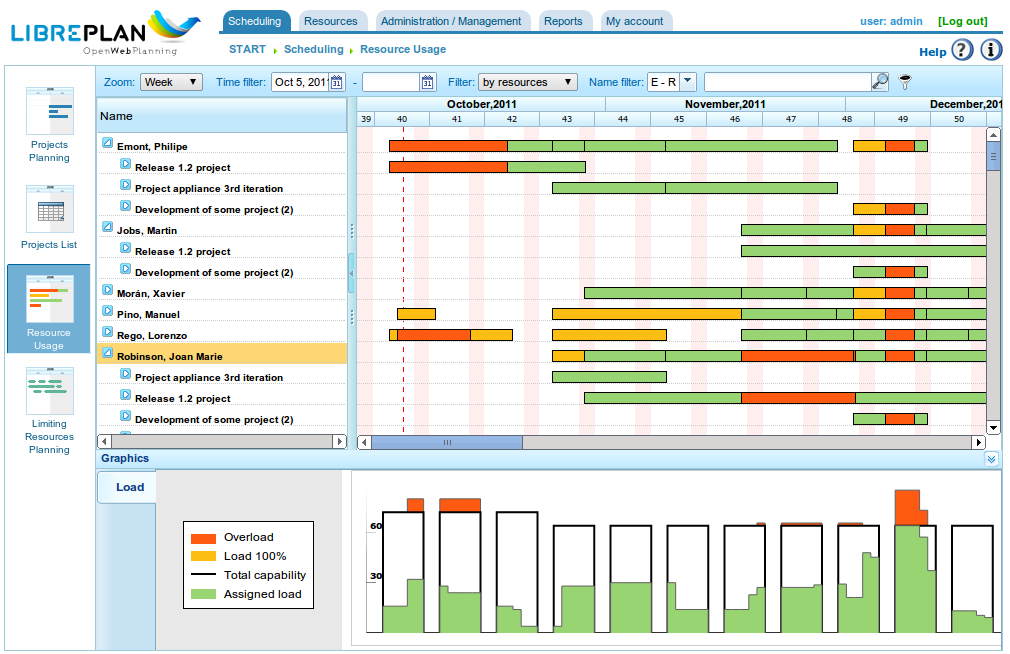
Resource Load View for a Specific Project
If the mouse pointer is placed on the resource's Gantt chart, the load percentage for the worker will be shown.
Project List View
The Project List View allows users to access the project editing and deleting options. See the "Projects" chapter for more information.
Advanced Assignment View
The Advanced Assignment View is explained in depth in the "Resource Assignment" chapter.